

Maps help us navigate the world, and they not only show us how to get from point A to point B, but, depending on the type of map, they can also help us to see where patterns, clusters, and gaps exist in a spatial environment. As part of KCARD’s state-wide Local Food System Expansion Initiative, a series of maps has been developed to visualize the Kentucky local food system. The purpose of these maps is to provide a tool for which local food professionals, farmers, buyers, and other interested parties can better understand what trends, growth, and decline have occurred in the local food system and help them to “navigate” future decisions and projects.
These maps, available here, are presented using a format called a story map, which, as the name suggests, presents the maps alongside a narrative. The maps are designed to be interactive, with features such as pop-ups (click a county!), zoom in/out, and a search bar. At the end of the page, you will find references for all data presented as well as links to our partnering organizations.
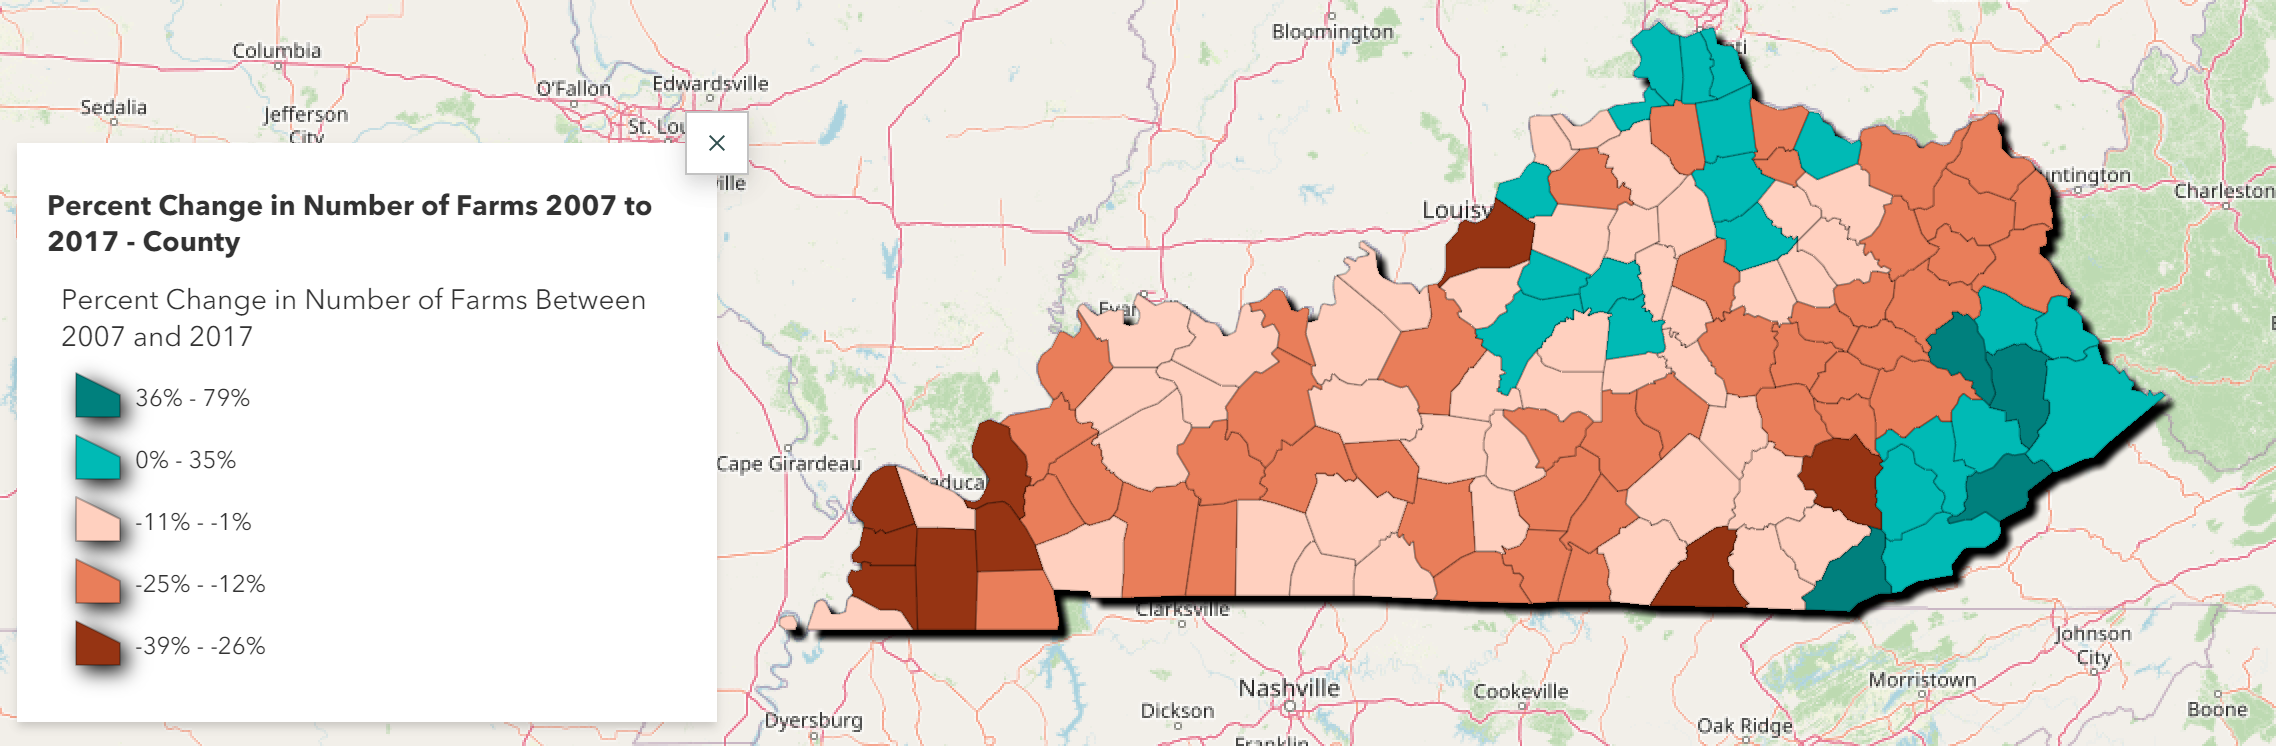
The first two maps provide an introduction to Kentucky’s local food system. Data for these maps was taken from the US Department of Agriculture’s Census of Agriculture years 2007 and 2017 and show the overall change in the number of farm operations and producers over that ten-year period. This includes all farm operations and producers, not just those participating in local food production. Ballard County saw the most decrease in farm operations (-39%) and Floyd County saw the most increase (79%). As for producers, Ballard County again, along with Graves County saw the most decrease in producers (-26%), and Knott and Bell counties saw the most increase (104%).
For an interactive view of the maps with county data, view the full website here.

Despite the general decline in operations and producers in most parts of Kentucky, KCARD has seen an increase in the number of farms and agribusinesses seeking business development assistance. The next maps show the number of KCARD clients by county in two points in time (2015 and 2020). The number of counties reached increased by 34% in that five-year period and the number of clients increased by 131%. Many of KCARD’s clients produce food products for the local market, whether that is direct-to-consumer or through wholesale.


Stay tuned for parts two and three in the next few weeks. We will present a closer look into local food sales in Kentucky and the various industries that make up the local food system.
Are you a producer looking to expand their sales beyond direct-to-consumer or a buyer looking to purchase local food? Contact us as kcard@kcard.info or 849-550-3972 today.